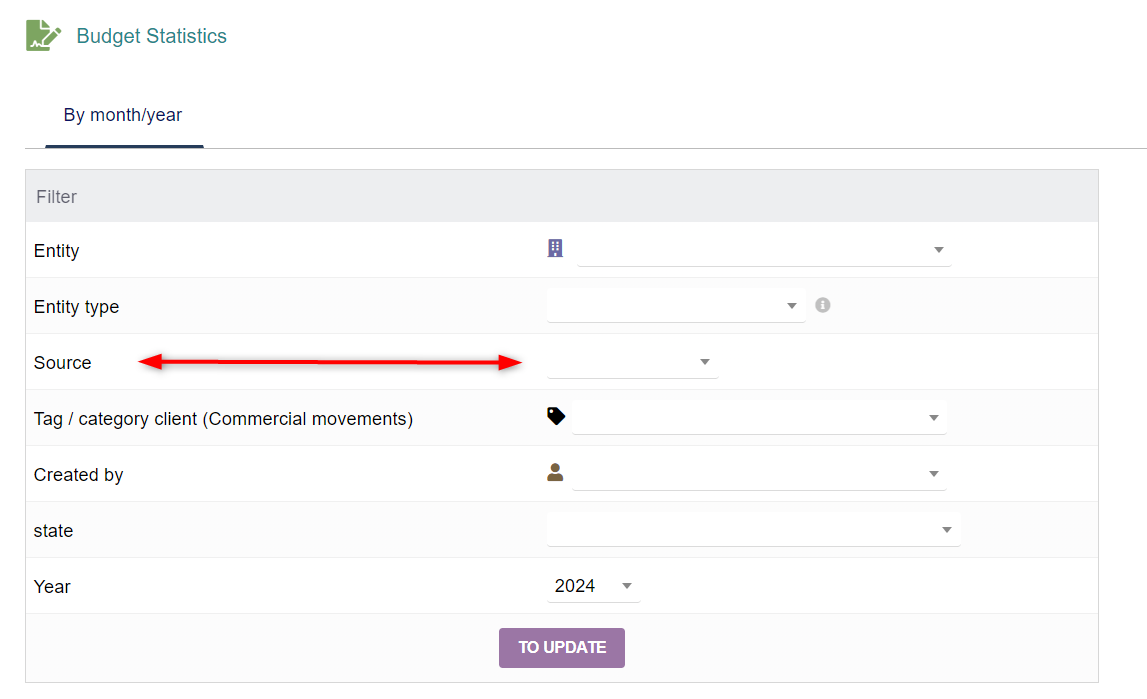
Hello everyone, I would like some help from you regarding customization. In the I see that there are some query filters to generate the graphs. I would like to filter the data by the “source” variable in the database as “demand_reason_id”. I even managed to put the information in the filter part as you can see. But I am having difficulty implementing the effects on the graph. Currently, when I select a value does not affect the results of the graph. Could someone tell me where I should make the change to change the query in the database and consequently the graph?